
What the filings of 16 semi-liquid private credit funds, and 13 liquidity events since 2007, show about where the cash to pay leavers comes from.
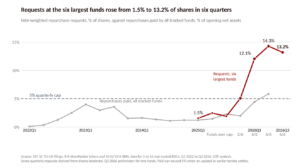
In the third quarter of 2026, shareholders in the six largest non-traded business development companies (BDCs) asked for 13.2% of their shares back. Each fund offered to buy 5%, and each paid its leavers pro rata. Six quarters earlier, requests across the same six funds were 1.5%. The 13.2% is not all new demand: shares that are not bought in one quarter can be put forward again in the next.
These funds hold loans with weighted average lives of several years and offer a quarterly window capped at 5% of shares. The scale is new; the mismatch between maturity and liquidity is not. The 16 funds in D3T’s sample, chosen because they report to the SEC, held less than $0.1bn of net assets at the end of 2020 and $137.6bn at the end of 2025. The Federal Reserve puts all semi-liquid private credit funds, meaning perpetual BDCs and interval funds, at $241bn of net assets, about 20% of the private credit vehicle total. How fast those funds can pay leavers depends on what they own, and this note sets their loan books against asset-backed pools that repay by contract.
Exhibit 1. Requests against the 5% cap, six largest tracked non-traded BDCs.
What the books repaid
The usual explanation for proration is that the loans are too slow for the promise. D3T tested that against the funds’ own quarterly filings, and in this sample the data do not support it. Over the first half of 2026 the median book across 15 funds was repaying or selling about 5.4% of itself a quarter, which implies an asset life of 4.6 years. Nine of the 15 books were running off fast enough to return all their capital inside the five years that a 5% quarterly cap implies, provided nothing was lent again. Across the group, implied asset life shortened from 5.4 years at the end of 2023 to 4.4 years by mid-2026, though the group changed over that time and loan sales count as proceeds.
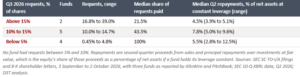
Repayment speed did not line up with which funds prorated either. Funds with third-quarter requests between 10% and 15% of shares had median second-quarter repayments equal to 7.8% of net assets, taken as the equity’s share if a fund holds its leverage constant. Funds with requests under 5%, which met every request, had 5.5%. The two funds with requests above 15% had 4.5%. With groups of two, five and four funds and overlapping ranges, this shows no link in these data, not that none exists. Boards set the offer, and a board can offer more, as one did in the first quarter.
Exhibit 2. Third-quarter 2026 requests against second-quarter repayments, 11 funds.
Demand did the separating, against an offer each board had set at 5%. One fund that met all its third-quarter requests reported inflows of about twice the amount asked for. Among the seven funds that prorated, a full quarter of gross proceeds from repayments and loan sales would have covered the whole request at three. Those are gross figures, before any debt is repaid or any loan is made. At the sample’s average leverage (0.89x debt to net assets, below) the equity’s share of that cash would be about half, which would leave all three short. Gross cash fell short at the other four, and two of them covered less than half.
Who carried the difference
Borrowing rose while requests did. Across ten funds that reported at both dates, debt increased 15.9% between 30 September 2025 and 30 June 2026 while net assets fell 4.0%. Debt to net assets went from 0.74x to 0.89x on average, inside the 2:1 limit available to a BDC whose board or shareholders have approved it. The rise in debt was about 12% of opening net assets, three times the fall in net assets, so assets grew: borrowing paid for new lending as well as repurchases, and these figures cannot say how much reached leavers.
The filings show facilities being renewed or enlarged in that period, with no cuts found. Those are commitments, not borrowing: at one large fund, whose shareholder letter calls its leverage essentially stable, a revolver was enlarged in August 2026. That was in the same months banks told the Federal Reserve, in its July 2026 survey of senior loan officers, that their standards on loans to non-bank financial institutions sat at the tighter ends of their historical ranges since 2011. US bank loans to non-bank financial institutions, a category much wider than private credit funds, rose from $589bn at the end of 2019 to about $2.0tn in June 2026 on the Fed’s H.8 series, although about $399bn of that increase came from loans reclassified into the category in 2025 and early 2026. Inside a fund, lenders rank ahead of the shareholders who stay, so any borrowing that pays for repurchases is a claim ahead of theirs.
Lenders here means more than banks. At one large fund at 30 June 2026, secured bank facilities were 23.7% of principal debt, unsecured notes 50.3% and CLO debt 26.0%, so bondholders and securitisation investors sit in that position as well as banks.
What only the asset can do
D3T’s research sorted the techniques used to meet requests by what each does to the gap between the promise and the cash. Caps and proration allocate the shortfall between leavers and stayers. Credit lines, loan sales and new subscriptions fund it, at a cost or for as long as inflows last. Notice periods and longer dealing intervals shorten the promise. Only the repayment of the assets shortens the gap itself, and no change in how fast the seven oversubscribed funds’ books repay has been reported for the third quarter; the filings that would show it are due in November. Repayment speed did not decide which funds prorated this quarter, because each board fixed its offer. It decides how long a queue lasts, and how much of it has to be met by borrowing or new money. At the median, a quarter of repayments and sales, at constant leverage, came to about 5.4% of net assets: enough to fund a 5% offer, not a queue more than twice that size. Much of that cash is also outside the lender’s control: a sponsor-backed loan is usually repaid when the borrower refinances or is sold, while an amortising pool repays through scheduled instalments.
This year’s filings show the other techniques at work. In the first quarter one fund raised its offer from 5% to 7% of shares and met every request. Press reports say it also took in nearly $2bn of new subscriptions and that its manager and employees invested about $400m, which met the 0.9% of requests above 7%. In February one manager’s BDCs sold $1.4bn of loans at 99.7% of par, and one of them replaced its quarterly tenders with returns of capital to all shareholders, the first of up to about 30% of net asset value.
Repayment speed varies widely by asset. Four securitisations of prime auto loans and of equipment loans and leases registered with the SEC repaid 9.6% to 11.6% of their pools a quarter on average in their first year, through scheduled payments and prepayments, with no sales. Four prime pools are a small set and do not stand for every type of asset-backed lending. The direct lending books in the BDC sample repaid a median 5.4% a quarter, and that figure includes loan sales. A UK pool of trade receivables, with about 43 days of sales outstanding, turns over roughly twice a quarter; no comparable US pool publishes the figure.
Exhibit 3. Share of the book repaid per quarter, by asset type.
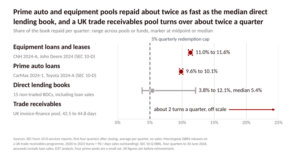
For an investor, that difference arrives as cash rather than as a valuation. A self-liquidating pool that repays a tenth of itself each quarter returns capital through its contracts, whether or not anyone is queuing to leave, and without needing a buyer for the loans or a lender to the fund. Measured the same way, that is nearly twice the cash the median direct lending book in the sample produced each quarter.
Thirteen events since 2007
D3T’s register of liquidity events runs from asset-backed commercial paper conduits in 2007 to this year’s non-traded BDC tender round. D3T classifies its 13 entries as follows: six began with a loss of confidence, three with a move in prices, two with a credit loss and two with a lender or insurer withdrawing. In each, a promise or obligation to pay cash ran faster than the assets could produce it. Three of the entries are outside the US and are kept because each shows a mechanism the US record does not: a daily-dealing UK equity fund holding unquoted shares, supply chain finance funds whose credit insurance lapsed, and UK pension funds facing collateral calls faster than they could be recapitalised.
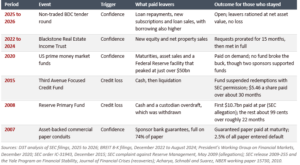
In D3T’s register, what decided the outcome for investors who stayed was whether something other than the assets paid the leavers. In 2007, 74% of asset-backed commercial paper carried a full bank guarantee, and guaranteed paper was paid at maturity. The Reserve Primary Fund had no such backstop in September 2008. The SEC’s complaint alleges that $24.6bn of the $62.4bn fund was requested by 9am on 16 September and that the fund could raise cash to pay only the first $10.7bn of those requests, at par. The remaining shareholders recovered about 99 cents on the dollar over roughly 22 months.
Exhibit 4. Six US liquidity events from D3T’s register of 13.
the Yale Program on Financial Stability, Journal of Financial Crises (recoveries); Acharya, Schnabl and Suarez, NBER working paper 15730, 2010.
The 2026 round differs from 2008 on each of the points that decided outcomes then. No fund in the sample has suspended redemptions, although in February one other BDC replaced its tenders with returns of capital, as described above. None promised a fixed price, and the filings read attribute no loss to forced sales. Leavers and stayers are both valued at net asset value, and the leavers wait.
What the queue measures
A redemption cap is usually described as a liquidity tool. This year’s filings show it creates none: it decides who waits. How long they wait depends on the assets, because once a queue forms it clears at the speed the book converts to cash, plus whatever lenders and new investors add, and no faster than the offer the board chooses to make.
That speed is in the public record. Every BDC reports its proceeds from repayments and sales, and its investments at fair value, each quarter, and the ratio of the two measures how quickly the book turns into cash, before debt is repaid or loans are made again. It is a better guide to how a queue will behave than the redemption terms, which describe how the queue will be shared, though it describes recent quarters, not a downturn.
About the evidence
The sample is 16 US non-traded BDCs that file structured data with the SEC, with quarterly request histories built for the six largest. The group is the funds that report today, so its history starts when each fund’s filings begin. Third-quarter requests are set against second-quarter cash flows, because third-quarter reports are filed in mid-November, and some third-quarter request figures are preliminary or estimated.
Proceeds include loan sales, so implied asset lives read short; they are gross of any debt repaid or new lending, and the filings read do not split contractual amortisation from prepayment. A few figures come from trade-press reports, as marked in the source register. Current funds are not named. D3T arranges and invests in short-dated asset-backed facilities, so it has an interest in this subject. The figures will be updated once third-quarter filings are available.
D3T Capital LTD is an Appointed Representative of Capricorn Fund Managers Limited, which is authorised and regulated by the Financial Conduct Authority. D3T Capital LTD is incorporated in England and the registered office is at Unit 17 Orbital 25 Business Park, Dwight Road, Watford, WD18 9DA, United Kingdom.
The investment products and services of D3T Capital LTD are only available to professional clients and eligible counterparties. They are not available to retail clients.
This article is general market commentary. It does not constitute an offer, invitation or inducement to invest in any product or service, it is not investment research, and it is not directed at retail clients. Figures are drawn from public regulatory filings, central bank and regulator publications, rating agency releases and academic papers, with dates, and are directional. Current funds are not named, and no view is expressed on the strategy, risk or performance of any manager or fund.