
Sub-$50m lenders that wrote fixed-rate assets in 2025 now fund them on a curve priced for hikes. D3T ran three illustrative $50m warehouses against today’s forwards to see where the margin goes.
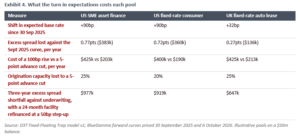
At the end of September 2025, the forward curve put three-month SOFR for this winter at 3.12%; the curve now says 4.02%. A lender that priced a fixed-rate book of equipment loans that month off the forward curve, and did not hedge, would have built that number into its coupon. More to the point, most lenders expected rates to keep falling, and some will have left books unhedged to benefit when they did; how many did so is not visible in public data. SOFR itself was 4.24% on 30 September 2025 and is 3.89% today, so funding is cheaper than when the loans were written; what has gone is the forecast fall in the curve. On a $50m pool funded at an 85% advance rate, the 90bp difference removes about $383,000 a year of excess spread against that expectation, before any cost of risk.
The curve turned quickly. The Federal Reserve raised its target range to 3.75% to 4.00% on 16 September, its first increase since July 2023, and the median projection for the 2027 funds rate moved from 3.6% in June to 4.1%. In sterling, Bank Rate is 3.75% and markets price a rise on 5 November as more likely than not. The US 10-year Treasury closed at 5.10% on 15 October. Not a violent squeeze, but enough to retire the idea that rates would “normalise” somewhere near 2%. After the IMF meetings recently, the reports from the likes of DBS and others on sovereign risk should put paid to any expectations of rate reductions generally.
Most commentary on this move has been about borrowers in commercial property and leveraged loans. That is where the big numbers sit, and most LBOs should be hedged anyway. Our interest is in a quieter corner: specialist finance companies writing fixed-rate equipment, consumer and auto assets, funded through floating-rate bank and private credit warehouses.
The 2025 margin came from funding
In the Equipment Leasing and Finance Association’s 2026 survey of activity, industry spread widened 40bp to 2.99% while the cost of funds fell 41bp to 4.40%. Net losses were 52bp and 98.5% of receivables were current. Interest expense took 40.4% of lender revenue, against a range of 20% to 30% between 2016 and 2023.
The asset side has held up since. KBRA’s equipment loan and lease ABS index for August 2026 shows annualised losses flat on the year and 60-day-plus delinquencies 10bp lower, with the small and mid-ticket sub-index improving on both measures, while large-ticket losses rose 9bp.
Last year’s widening came almost entirely from the liability line, and that line is now moving the wrong way for platforms whose assets are fixed.
Three $50m pools on today’s curve
D3T built three illustrative $50m pools from published market ranges. None reflects the terms of any D3T facility or client.
Exhibit 1. Three illustrative $50m pools.
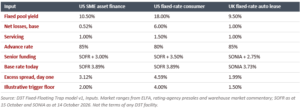
Excess spread is what the pool yields after losses, servicing and the cost of senior funding. A rise in the base rate reaches it at the advance rate: 85bp of excess spread for every 100bp at an 85% advance. The first-loss holder takes the same move multiplied by a / (1 − a), about 5.7 times at 85%. The question for each pool is how much headroom sits between day-one excess spread and the trigger that would divert cash to the senior lender. The test holds each pool’s fixed yield and balance as they are. A revolving warehouse would reprice new loans as old ones repay, which could slow the erosion.
Exhibit 2. Headroom to the trigger as the base rate rises.
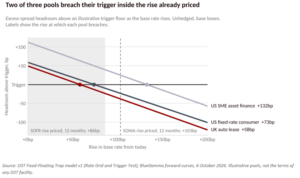
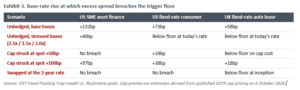
Unhedged and at base losses, the UK auto pool reaches its floor after a 58bp rise in SONIA and the US consumer pool after a 73bp rise in SOFR. Forward curves on 6 October priced rises of 103bp and 86bp respectively over the coming 12 months. Both pools breach on the priced path with no change in credit. The SME pool holds until +132bp at base losses, but at 2.5 times base losses it breaches at +40bp.
The trigger levels are our assumption, set below day-one excess spread in line with typical structures, and real documents vary. The answer depends on them: with floors 50bp lower, the consumer pool would breach at +136bp and the auto pool at +117bp, both outside the rises priced. What carries across to real deals is the headroom: between 49bp and 112bp of excess spread, against 69bp to 88bp of erosion already priced.
Exhibit 3. Base-rate rise at which excess spread breaches the trigger floor.
A hedge is a price, and thin books struggle to pay it
A two-year SOFR cap struck at 4.00% was indicated at 1.47% of notional on 6 October, about $735,000 on a $50m notional; the three-year equivalent was 2.46%. A pool funded at an 85% advance would hedge its $42.5m of senior debt, so the cost there is about $625,000. The model charges each premium to excess spread evenly over the cap’s life, so those premia come out of the same excess spread the cap is meant to protect.
On the SME pool, a cap at spot plus 50bp costs an estimated 47bp of excess spread a year and removes the breach entirely. The cheaper cap at spot plus 100bp breaches sooner than no hedge at all: the premium uses up headroom before the cap starts paying, and the pool breaches at +97bp rather than +132bp. The breach is shallow, though: with the cap paying above +100bp, excess spread stops falling, while the unhedged pool keeps falling. On the UK auto pool, the premium on the closer cap is enough on its own to take excess spread below the floor on day one. A two-year swap is no better there, because the sterling curve already prices the rise: fixing at 4.63% against spot SONIA of 3.73% gives up 77bp of excess spread from the start.
When a cap bought two years ago expires on assets with a year left to run, the lender’s first-loss capital pays to replace it, at today’s prices out of today’s equity, and that will be expensive.
Where losses still outweigh rates
The consumer pool does not fit the pattern. At 6% base losses, a 1.5 times loss stress removes 300bp of excess spread, against 80bp for a 100bp rise in SOFR. For a near-prime consumer book the credit line still dominates, and a lender there should watch arrears before it watches the curve. Underwriting and asset management earn the margin; hedging only protects it. KBRA’s marketplace consumer loan index showed a ninth consecutive year-on-year improvement in losses in June, and losses were 148bp lower than a year earlier in August, although delinquencies rose 26bp in June as late-2025 loans seasoned. For now the stress remains hypothetical.
For equipment and auto books, with losses at or around 1%, the balance runs the other way. A 100bp move in the base rate costs the SME pool more than a doubling of its losses and costs the auto pool almost as much.
The funder’s cheaper lever
A warehouse funder worried about this has two levers: reprice the margin or cut the advance rate. On the SME pool, a 100bp rise costs the lender about $425,000 a year. A 5-point cut in the advance rate costs about $203,000 a year in carry, because $2.5m of senior funding has to be replaced with equity at an assumed cost of 15%. A margin increase of about 48bp would cost the lender the same. The cut is cheaper in carry and far worse for growth: on a fixed equity base it removes a quarter of the assets the lender can finance, and equity is hard to come by at the moment.
The one published renewal we found, from a large listed subprime auto lender, points to funders competing on price for floating secured paper while fixed-rate paper reprices. Credit Acceptance extended its $500m warehouse in September with the margin cut from SOFR plus 185bp to SOFR plus 175bp, while the fixed rate on a $500m asset-backed term facility, whose revolving period was also extended, rose from 5.43% to 5.83%. New-issue structures are thinner too: S&P estimated initial excess spread of 3.25% for CarMax Auto Owner Trust 2026-1 against 4.29% on 2025-4, measured after pricing and so not like for like, and Fitch’s presale for Ford Auto Securitization Trust II 2026-B, a Canadian prime auto pool, shows about 1.75%, down from 2.30% on 2026-A. These are large issuers, and a sub-$50m lender would see very different terms.
Exhibit 4. What the turn in expectations costs each pool.
Lenders expect demand to soften
New business is repricing. The average rate small US firms report paying on short-term loans rose to 8.2% in September from 7.4% in June, according to the NFIB. In the UK, the average rate on new personal loans was 9.96% in August against 8.32% a year earlier, while Bank Rate fell 25bp over the same period. That fits lenders pricing new fixed-rate credit off swaps rather than Bank Rate, although the mix of borrowers also moves the average.
In ELFA’s October confidence survey, the share of equipment finance executives expecting demand for capital expenditure financing to rise fell from 31.8% to 18.2%. Only 19.0% expect better access to capital, down from 27.3%, although none expects it to get worse. For an illustrative borrower with $600,000 of EBITDA, a floating working-capital line and a 2025 fixed-rate equipment loan, a 100bp rise adds about $12,700 to annual debt service and moves cover from 1.49x to 1.44x. The cost arrives through the working-capital line and the price of the next machine, which shows up first as a deferred order. On those numbers, confidence is doing more damage than the spread.
What the next six weeks won’t show
The Federal Reserve meets on 27 and 28 October, the UK Budget follows on 28 October and the Bank of England decides on 5 November. None of those dates will show whether the trap is closing. That evidence sits in the monthly servicer reports of 2025-vintage pools, and most small-ticket equipment and fintech consumer deals are privately placed, so those reports are not public. We have not seen excess spread fall in published pool data yet. The pattern to look for is excess spread drifting towards its trigger while delinquencies stay flat.
For a funder or an allocator, three questions are worth putting to any lender. How much headroom sits between excess spread and the trigger at the forward curve rather than at spot? When does each hedge expire against the life of the assets it covers? And how much origination would a 5-point advance cut remove? A lender that has those answers to hand has already worked out who pays.
Notes
- The three pools are illustrative. Inputs are drawn from public market ranges, published presales and industry surveys, and do not represent the terms, pricing or performance of any facility arranged or held by D3T or its clients. Trigger floors are assumptions. Cap premia for strikes at spot plus 50bp and plus 100bp are D3T estimates derived from a published two-year SOFR cap quote.
- Forward rates are as priced on 30 September 2025 and 6 October 2026; spot SOFR is as at 15 October 2026 and SONIA as at 14 October 2026. Market pricing of central bank decisions is reported as observed and is not a forecast by D3T. Forward and cap figures are indicative levels published by BlueGamma, not dealer quotes.
- Companies are named only for terms in public filings and rating-agency presales. No view is expressed on any company’s securities.
- D3T arranges and invests in asset-backed facilities for specialist lenders, so it has an interest in how those facilities are structured and funded.
D3T Capital LTD is an Appointed Representative of Capricorn Fund Managers Limited, which is authorised and regulated by the Financial Conduct Authority. D3T Capital LTD is incorporated in England and the registered office is at Unit 17 Orbital 25 Business Park, Dwight Road, Watford, WD18 9DA, United Kingdom.
The investment products and services of D3T Capital LTD are only available to professional clients and eligible counterparties. They are not available to retail clients.
This article is general market commentary based on public data, rating-agency publications and an illustrative model. It is not an offer, invitation or inducement to invest, and it is not investment research. The model pools do not represent the terms or performance of any facility or fund arranged, managed or held by D3T. Market pricing is reported as observed and is not a forecast. No view is expressed on the securities of any company named.